


Once a user signs up for a free trial or one-month-only plan of your SaaS product, the race is on to convince them that your product is worth paying for in the long-term. To do this, you need to deliver an onboarding process that fully, and quickly, promotes the value of your solution. This, of course, requires you to track the right onboarding metrics.
User onboarding metrics are measurements that help you understand, evaluate, and improve your onboarding process. They play a critical role in sales performance because they report whether your onboarding efforts successfully lead users to conversion.
But which metrics should you track? Before we explore the top onboarding metrics to monitor, let’s quickly discuss why onboarding is so important.
Why measuring user onboarding is important for sales performance
For SaaS and subscription-based services, an effective onboarding experience is the key that turns non-committal, free trial users into long-term paying customers.
A good onboarding flow is designed to smoothly and efficiently guide users from setup to proficiency. It doesn’t just teach customers how to use your product — it teaches them how to extract maximum value from it, ultimately helping them meet their desired outcomes with minimal friction.
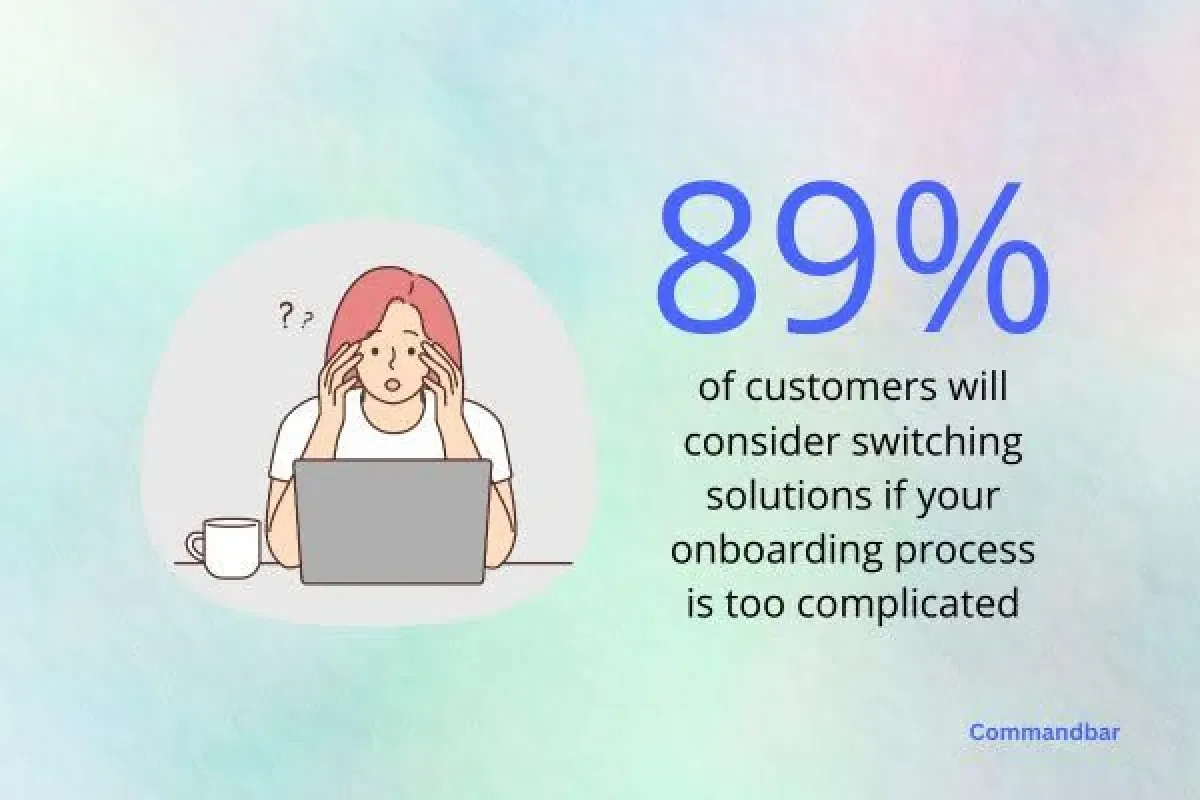
To put this into perspective, our user onboarding survey discovered that 90% of potential customers will consider switching to a competitor if your solution has a complicated onboarding process.
Measuring onboarding metrics can illuminate strengths, uncover weaknesses, and help you capitalize on opportunities to attract and retain more customers.
For example, it can help you:
- Identify gaps and obstacles in your onboarding process that cause friction and churn.
- Prioritize features and functionalities that lead to higher engagement, activation, and increased time to value.
- Optimize and personalize your onboarding flow to drive quicker conversions.
Essential user onboarding metrics to track
So, which onboarding metrics and KPIs should you track? Let’s walk through the most essential onboarding metrics for SaaS companies.
Onboarding completion rate (OCR)
Onboarding completion rate calculates the percentage of users who complete all the key steps in your onboarding process. It’s a main indicator of how well your onboarding flow supports new users as they set up, activate, and deploy your product, guiding them to become confident users.
Ideally, you want an OCR of 100%. A low completion rate often suggests that there are critical flaws, complexities, or obstacles in your onboarding flow, such as an unintuitive user interface or a lack of helpful resources.
Identifying and removing these friction points can boost OCR. Gamification, such as progress bars and checklists, can also help.
How to calculate: (Total number of successfully onboarded users / Total number of users who sign up to your onboarding process) x 100.
Time to complete onboarding
How long does it take users to complete your onboarding process? Or, in other words, how many days does it take for users to fully understand your product and begin independently applying it to their workflow?
The faster users complete your onboarding journey, the faster they’ll upgrade to a paid subscription or purchase a high-priced package. So, your onboarding flow should be optimized to lead customers to completion quickly.
How long it takes to complete onboarding will depend on the complexity of your product. Aim to simplify and personalize the process as much as possible, eliminating unnecessary steps and friction points.
How to calculate: Measure how many days it takes for users to complete the onboarding process.
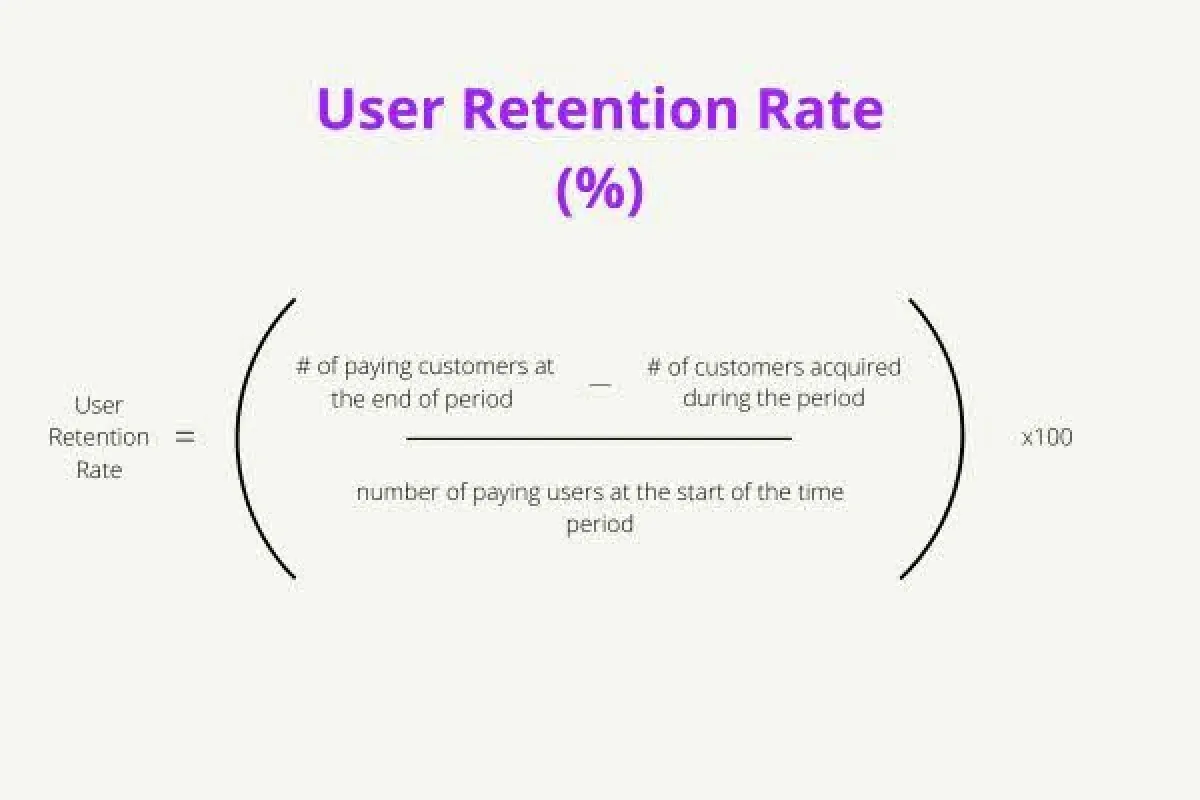
User retention rate
User retention rate measures how many customers continue to use your product after a certain amount of time, such as a month or quarter.
Along with churn rate, retention rate can reliably tell you how successfully your onboarding process retains customers. And, on a deeper level, it helps you evaluate whether your product continues to meet the needs of newly onboarded users.
How to calculate: Subtract the total number of customers you acquired within a specific period from the total number of paying customers you acquired. Then, divide it by the total number of paying users at the start of the time period. Here’s a visual to help:
Churn rate
On the flip side there’s churn rate, which measures how many users disengage or unsubscribe from your product. Measuring churn rate in conjunction with retention rate gives you a more comprehensive picture of how effectively your onboarding process retains customers.
Churn happens for a variety of reasons like, for example, when it takes users too long to recognize your product’s value. You can reduce early customer churn by showcasing your product’s standout features, targeting customers at risk of churn with personalized messages, and integrating AI-powered user assistance (more on that later).
It may even be that early customer churn happens because the user wasn’t the right audience for your product. In this case, refine your buyer personas and targeted marketing strategies to ensure that you’re attracting the right audience. An SEO agency B2B (or B2C) can help you do this.
How to calculate: (Lost customers / Total number of customers at the beginning of the period) x 100.
Time-to-value (TTV)
Time-to-value calculates, on average, how long it takes users to recognize the full value of your product.
Reaching that “aha! moment” — which is where the user realizes that your product can deliver the results they want — is a key step in the user onboarding journey. It’s typically the point at which engagement and satisfaction soars, and free trial users consider converting to paying customers.
A short TTV proves that your onboarding process successfully showcases your product value.

How to calculate: Define what “value” means for your customers and measure how long it takes them to recognize this value. Depending on your product, your customer may reach their “aha! moment” when they notice an increase in productivity or leads, or when they complete their first project. Use surveys, feedback, and in-built analytics to collect this data.
User activation rate
Your activation rate tells you the percentage of users that reach specific activation milestones. You can think of activation milestones as mini “aha! moments”. Essentially, they’re the key interactions that users must have with your product in order to fully understand it.
When users hit your activation milestones, it increases the chances of them becoming long-term paying customers. During the onboarding process, you should aim to guide users toward completing these activation milestones, creating an onboarding flow that’s smooth and efficient.
How to calculate: (Total number of users who reach a specific activation milestone / total number of acquired customers during a specific period) x 100.
User engagement rate
Engagement rate is a key metric that tracks how often customers actively and meaningfully engage with your product.
Low engagement rates are a cause for concern, as they suggest that you’re failing to showcase and continuously demonstrate product value. They may also signify that you’re attracting the wrong target audience, which can occur due to poor SEO and link-building strategies. SaaS link building agencies can help you build a solid foundation of high-quality links that pull in high-quality traffic.
High engagement rates, on the other hand, indicate that users are finding enjoyment and/or value in your platform, and are resonating with your onboarding process.
To increase early engagement rates, use tactics like product tours, personalization, and gamification. Our research found that product tours are 81% of users’ favorite in-app guidance resources.

How to calculate: (Number of customers who actively engage with your product within a specific time period / Total number of users signed up within this period) x 100.
Furthermore, incorporating engagement metrics into a successful sales kickoff campaign can provide valuable context for your sales team, helping them to tailor their strategies effectively and align with user interests.
New user support ticket volumes
How many support tickets are you generating from new users? If it’s a lot, it may be that your onboarding process isn’t providing the knowledge customers need to use your product independently and effectively.
The result? Users are forced to pause their journey and contact support, creating friction in the user experience and increasing the likelihood of churn.
Identify the main reasons why new users contact support by tracking and analyzing support tickets. From there, resolve pain points by creating a smooth, intuitive onboarding journey that guides users toward activation points. Provide plenty of in-app resources that customers can refer to, such as step-by-step walkthroughs, how-to guides, and FAQ pages.
Also consider using an AI-powered user assistant. Command AI’s CoPilot, for example, can be embedded unintrusively into your onboarding process. Fully equipped to conduct walkthroughs and resolve user questions, CoPilot is always available to offer proactive and reactive assistance, empowering users to immediately overcome obstacles.
How to calculate: Track how many support tickets you receive from new users within a specific time period, keeping an eye out for any spikes.
Free trial conversion rate
Lastly, we have ‘free trial conversion rate’. This metric measures exactly how many free trial users go on to become paying customers.
Free trials onboard customers onto your product while showcasing the potential value of your paid version. Tracking free trial conversion rate verifies that your free trial is educational, engaging, and valuable enough to convince customers that your product is worth it.
How to calculate: (Total number of free trial users who convert / total number of free trial users within the specific timeframe) x 100.
Key takeaways
User onboarding metrics provide insight into the success of your onboarding strategy, specifically how effectively it converts users into returning customers.
Knowing the right metrics to track helps you spot the strengths, weaknesses, and opportunities that exist within your onboarding process. And when you also know how to improve these metrics — for example, through personalization, simplification, or AI-powered support — you can engage, convert, and retain more users, boosting business growth.
Bio:
Nick Brown - Founder and CEO
Nick Brown is the founder & CEO of accelerate agency, the SaaS SEO agency. Nick has launched several successful online businesses, writes for Forbes, published a book and has grown accelerate from a UK-based agency to a company that now operates across US, APAC and EMEA. Here is his LinkedIn.