


How should you measure success in your product? The good news is that it's an impossibly hard question to answer. The bad news: There's no right answer.
Companies and products are too different to determine a single metric across all of them: A marketplace might measure GMV, a SaaS business ARR and a social network MAUs.
You can't just transplant someone else's metrics. But you also can't fly blind and not measure success.
That's why you need to develop your own product metrics framework: The set of numbers that help you evaluate success and failure.
What is a product metrics framework?
A product metrics framework is a comprehensive, coordinated set of quantitative and qualitative measurements used to evaluate a business's or product’s performance throughout its lifecycle.
But selecting the right one for you can be tricky. In this article, we'll dive into the different options, their pros and cons, and there's also a little quiz to help you find the one that works best for you and your context.
Contents
- Product metrics framework vs. Key Performance Indicators
- Quiz: which product metrics framework is right for you?
- Results: diving into the framework weeds
- Lagging vs. leading indicators
- Closing thoughts
Is a product metrics framework the same as key performance indicators (KPIs)?
A KPI is a metric that reflects a strategic goal that your team or company is aiming for. There are frameworks for defining KPIs, but they are often specific, outcome-oriented, actionable, and quantifiable. Some quick examples of KPIs are
- 1000 demos booked this month
- 250 demos converted to users
- The average customer session duration is 2 hours
KPIs can definitely complement a product metrics framework, but they are not the same. For teams just getting started, first employing a product metrics framework can help you form a solid base. From there, you can tack on KPIs as needed.
A product metrics framework is a cohesive suite of metrics that works together to monitor your product and flag alarms. KPIs are individual figures telling you whether your product accomplished various milestones.
How using a product metrics framework can help you
Product metric frameworks, when well-tailored, help product managers in a few ways:
- Coverage -- knowing these metrics gives you a complete view of your product
- Coordination -- the metrics complement one another; not only do they answer individual questions, but they can be tied together to unlock deep findings
- Organization -- it should be clear what parts of the product are or are not doing well
- Actionability -- once problems are identified, the right metrics are in place to point your team toward a solution
Why does it matter what product metrics framework you use?
Whatever you do, avoid vanity metrics
Product metrics matter, but you need to make sure you choose the right ones. It is very common for a product manager or founder to obsess over product usage data, but many can prove to be vanity metrics. What are some examples of vanity metrics?
- Number of users that tried a feature
- Number of times a user took action x
- New users or new waitlist signups
These metrics can be fun to track because they are easy to calculate and because they almost always increase. However, they do not add much value. For example, these metrics don't tell your team what is working well, how many users enjoy using the product, how customer acquisition cost influences your growth, or how much traction your product has. Vanity metrics can be dangerous because they lull you into a false sense of security.
Finding your north star(s)
The right product metrics framework helps your team stay on track and build toward success. The product metrics you land on should enable your product managers to more easily and more effectively (a) identify what to work on and (b) prioritize items.
On the other hand, employing the wrong framework can lead to wasted effort and/or obscure problem areas. You don't want to end up in the desert chasing a mirage.

Quiz: which product metrics framework is right for you?
Before defining product metrics, answer the questions below - select the option that feels like the closest fit. Based on your answers, we'll recommend a framework that is right for your product.
1. What is your primary business objective?
A. Maintain customer satisfaction and optimize for loyalty
B. Improve existing features to enhance exceptional user experience
C. Acquire new customers
2. Which of these metrics does your business primarily track?
A. Customer retention
B. User engagement
C. Revenue growth
3. How would you describe your current customer base?
A. Loyal -- your customers value your brand and product
B. Diverse -- your customers have varying needs and preferences
C. Rapidly expanding -- you’re just getting started!
4. Which of these best describes your business?
A. An established business that provides a recurring product or a subscription service
B. A digital product, like an app or an online platform
C. A startup
Results: diving into the framework weeds
Mostly A's: The Flywheel framework
If you chose mostly As, the Flywheel product metrics framework may be the best product metrics framework for your business. This framework focuses on creating a virtuous cycle of growth through customer loyalty. The Flywheel framework provides a holistic approach to measuring and optimizing customer acquisition, retention, and loyalty.
The core idea is that satisfied customers lead to organic growth, which, in turn, leads to even more satisfied customers. Fundamentally, the Flywheel framework encourages businesses to drive sustainable growth by building enduring customer relationships; it aims to optimize and continuously improve the entire customer journey.
The Flywheel framework is a great fit for businesses that are focused on long-term growth and customer retention rather than short-term wins. It is particularly well-suited to businesses that offer products or services that feature a subscription-based model.
Mostly B's: The Google HEART framework
If you chose mostly Bs, consider Google’s HEART framework, which is designed to measure user experience. The HEART (Happiness, Engagement, Adoption, Retention, Task Success) framework is a user-centered approach to measuring a product’s success. It consists of five dimensions, each of which is designed to track and quantify a different aspect of the user experience.
- “Happiness” measures the user’s overall satisfaction with the product; example metrics: net promoter score, customer satisfaction score
- “Engagement” measures how users interact with the product; example metrics: daily active users (DAUs), monthly active users (MAUs), average session duration, average session frequency
- “Adoption” measures how many users are sticking with your product; example metrics: percent of users that completed onboarding, percent of users that met the criteria for an "aha" moment, percent of users that tried a key feature
- “Retention” measures the user’s likelihood of returning to the product; example metrics: percent of users that churn, number of non-new users that are active
- “Task Success” measures the user’s ability to accomplish goals with the product; example metrics: error rate, time to first in-app action, time to "aha" moment
The HEART framework is ideally suited to businesses that offer digital products or services, prioritize user experience, and want to eliminate user friction and identify areas for improvement. When implemented well, this framework should clarify the user journey and the common modes of user behavior.
Mostly C's: The Pirate Metrics framework
If you chose mostly Cs, the Pirate Metrics framework might be the best fit. This framework is ideal for startups that want to optimize for rapid customer acquisition and revenue growth. The Pirate Metrics name comes from the sound of its accompanying acronym: "AARRR." It focuses on customer acquisition, activation, retention, referral, and revenue.
- “Acquisition”: attracting new customers
- “Activation”: converting those customers into active users
- “Retention”: keeping users engaged over the long term
- “Referral”: turning users into advocates who bring in new customers
- “Revenue”: generating profit
The Pirate Metrics framework provides a systematic, data-driven roadmap for acquiring customers and generating revenue. It is especially suited to businesses that have a clear conversion funnel.
For example, you might have the following funnel for your product:
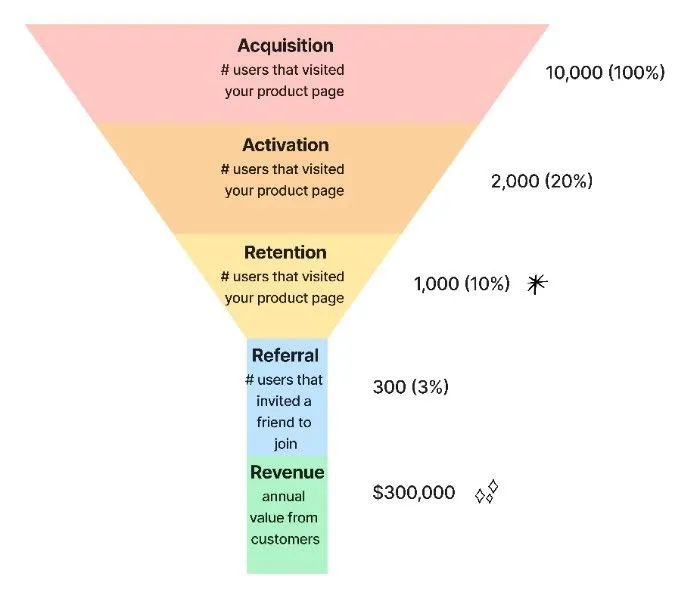
Beyond the metrics, the Pirate Metrics framework can help product managers or founders prioritize work. Categorizing each ticket or task can reveal gaps. For example, after looking at your last few sprints, you might realize that your team has been focusing too much on bottom-of-funnel problems.
Lagging vs. leading indicators
Plant care indicators
Imagine you have a friend that is leaving the country for a few months, and they have a bunch of houseplants that need to be taken care of.
If you rely solely on the general look of the plants ("oh shoot, leaves are starting to drop") to tell how well they're doing, you are in for a bad time. In the plant world, the general look of a plant is a lagging indicator. Once plants start to "look bad," it can be challenging to solve the issue quickly. It takes time for any action you take at this point to produce positive results.
So what does "good" look like? You want to know that problems are occurring ASAP so that you can solve them. This might mean examining the following on a daily basis:
- The surrounding environment -- What are the temperature maximums and minimums? What kind of light is the plant getting? How many hours of direct sun is the plant getting? What is the room humidity?
- Soil health -- How wet is the soil? What is the acidity level?
- Leaf health -- Are leaves curling? Are they becoming discolored at all? Do they feel soft?
- Growth -- Are new leaves coming in?
If you are clued in on these metrics, you can take action faster and avoid major issues. Your friend will also be very happy when they return to see their plants thriving.
Questions to assess your own product metrics' lag
The same lessons of plant care apply to your product metrics. You want to equip your team with leading indicators so that the team can solve problems before they impact many users. It can be enlightening to ask yourself the following questions, considering the product metrics you have selected.
- How long will it take me to know if the product is doing well?
- How long will it take me to identify problems?
- Will I know where to look for a solution in my product based on the identified problem areas?
If you aren't satisfied with the speed to solution, then you likely need to add leading indicator(s). It can help to get more specific and/or to introduce new metrics.
The best leading indicator? Frustration
One of the most powerful ways to find leading indicators of potential churn is to identify frustration early, when users are running into roadblocks or deadends in your product. There are two primary ways that you can measure this.
One is through traditional user engagement and feedback gathering. You can run targeted and timely microsurveys after specific features are used to gather a customer effort score, a customer satisfaction score, and use this data to inform your product decision-making. You can easily build these in Command AI and quickly target them and launch them even without technical help.
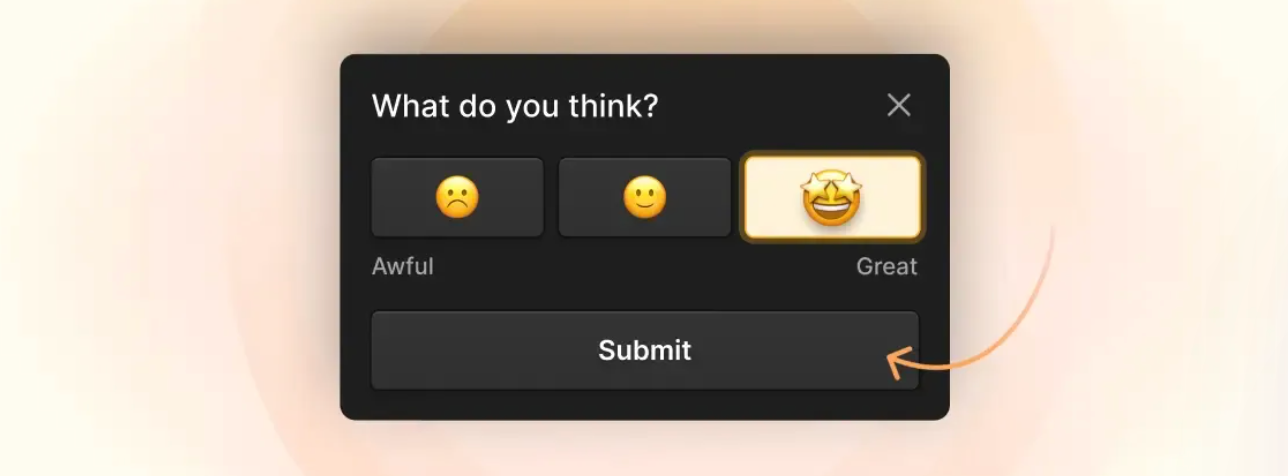
What's best is that you can actually trigger microsurveys after specific user behaviors, like frustration and rage clicking!

This means you can get accurate feedback on what went wrong in that moment!
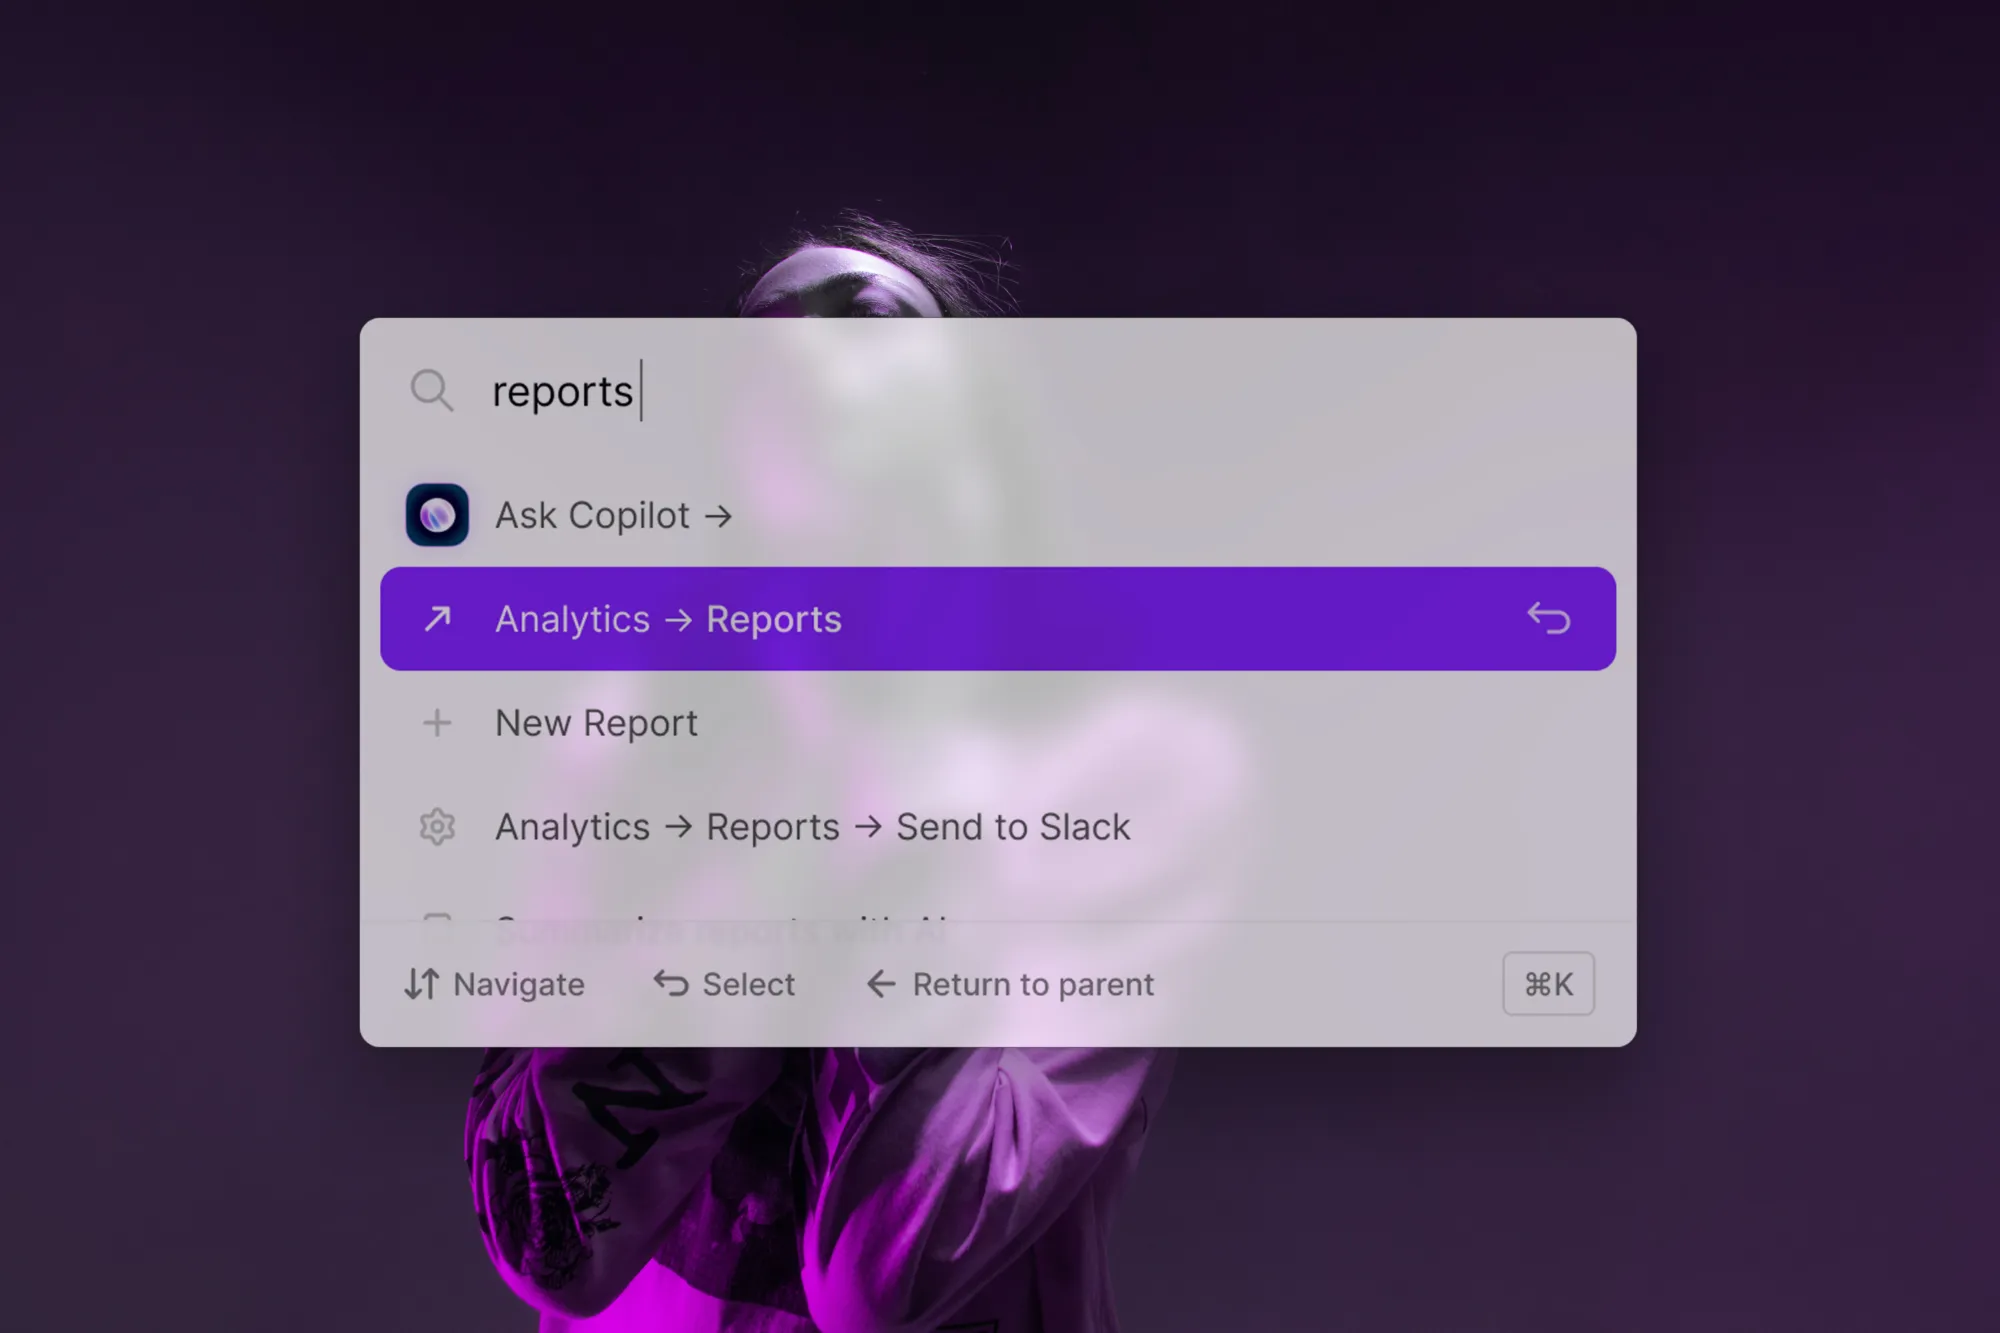
The other way to identify frustration early on is to use something like our Copilot user assistance tool.
This is in the bottom right of your product, and your users can interact with it, ask questions, and get answers that are all pulled and trained on your help documentation.
As you can imagine, this reduces the tickets that you receive, eases the burden on your support team, and also gives you valuable insight into where your product and your help documentations are failing. That's because you can see when responses aren't satisfactory and users hit a dead end in your dedicated dead ends dashboard.
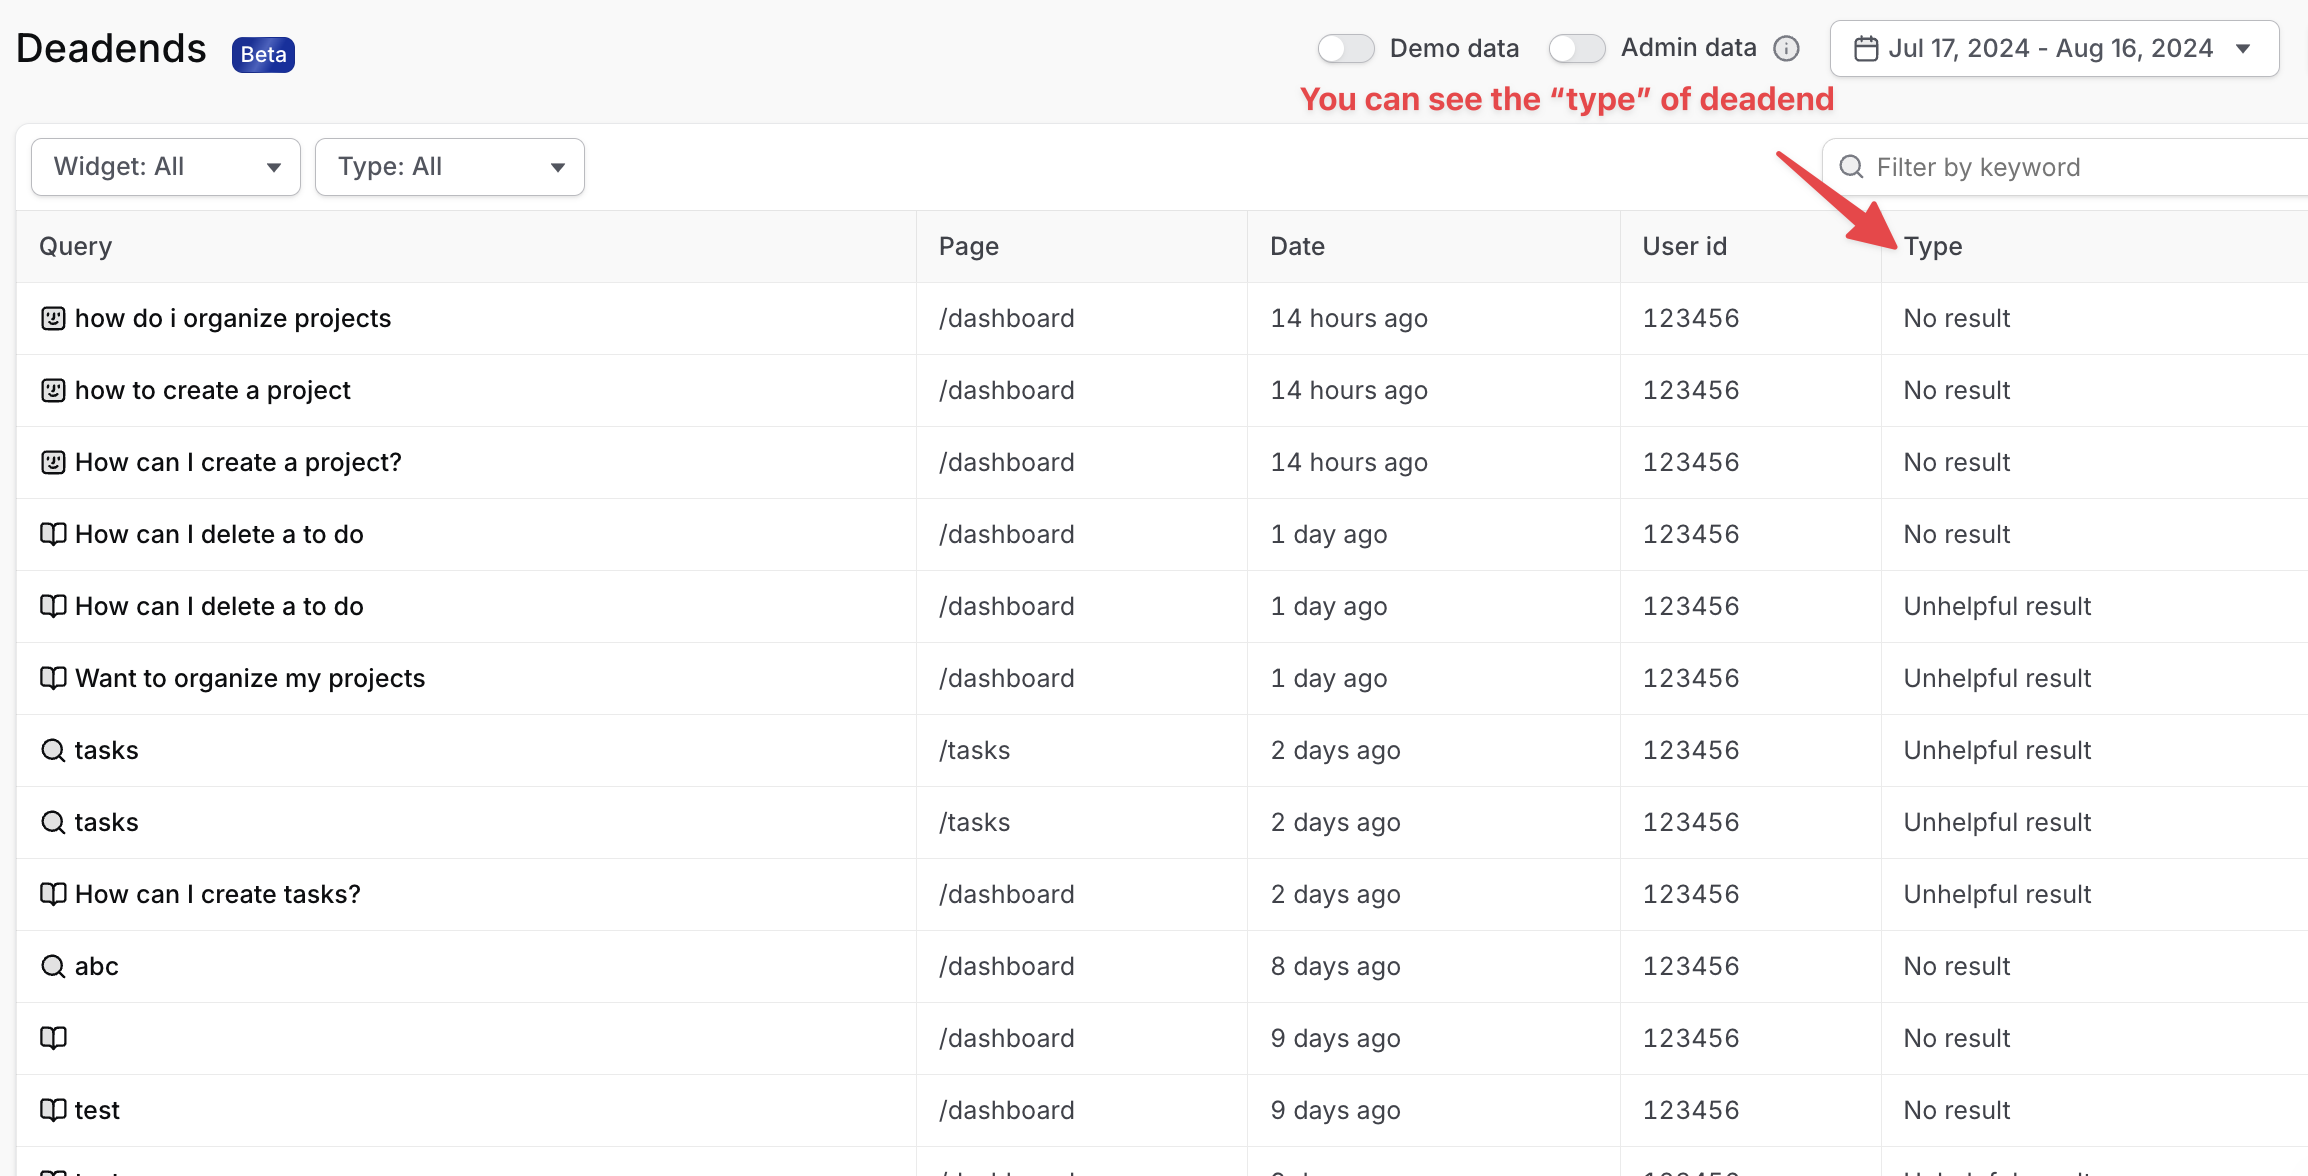
You can also see how people are talking, thinking, and interacting with your product.
When you identify frustration early, it can be a great leading indicator of churn. Make sure that you're both running a comprehensive cohort of microsurveys and feedback engagement to get early leading indicators of potential churn or product issues, as well as having a more autonomous and AI-driven user assistant in place like Copilot that gathers all that data for you and presents it in a clear way to find out issues early.
Closing thoughts
A product metrics framework is a vital tool for any SaaS business looking to effectively measure, evaluate, and improve product performance. By using a framework that suits your business objectives, customer base, and priorities, you can effectively monitor your product and identify areas for improvement, ensuring that your product continually evolves to meet the needs of your users. Focusing on meaningful, actionable data will help your team make decisions confidently. Take the necessary time to assess your options, craft a framework that works for you, and assess/iterate as needed.