Product tours analytics
Imagine you lay out a trail of roses to lead a special someone to a special meeting place. You carefully lay each petal, imagining how they will be followed effortlessly. You reach the end, and pause, awaiting the person you had intended to follow the trail.
Minutes go by. You begin to sweat.
You retrace your steps and find the tour-recipient wandering aimlessly in the middle of your petal tour.
This is not a good outcome! Product tours, when deployed judiciously, are meant to lead a user through a flow. Our product tour analytics page measures whether your tours are doing that, being ignored, or (worst of all) annoying your users.
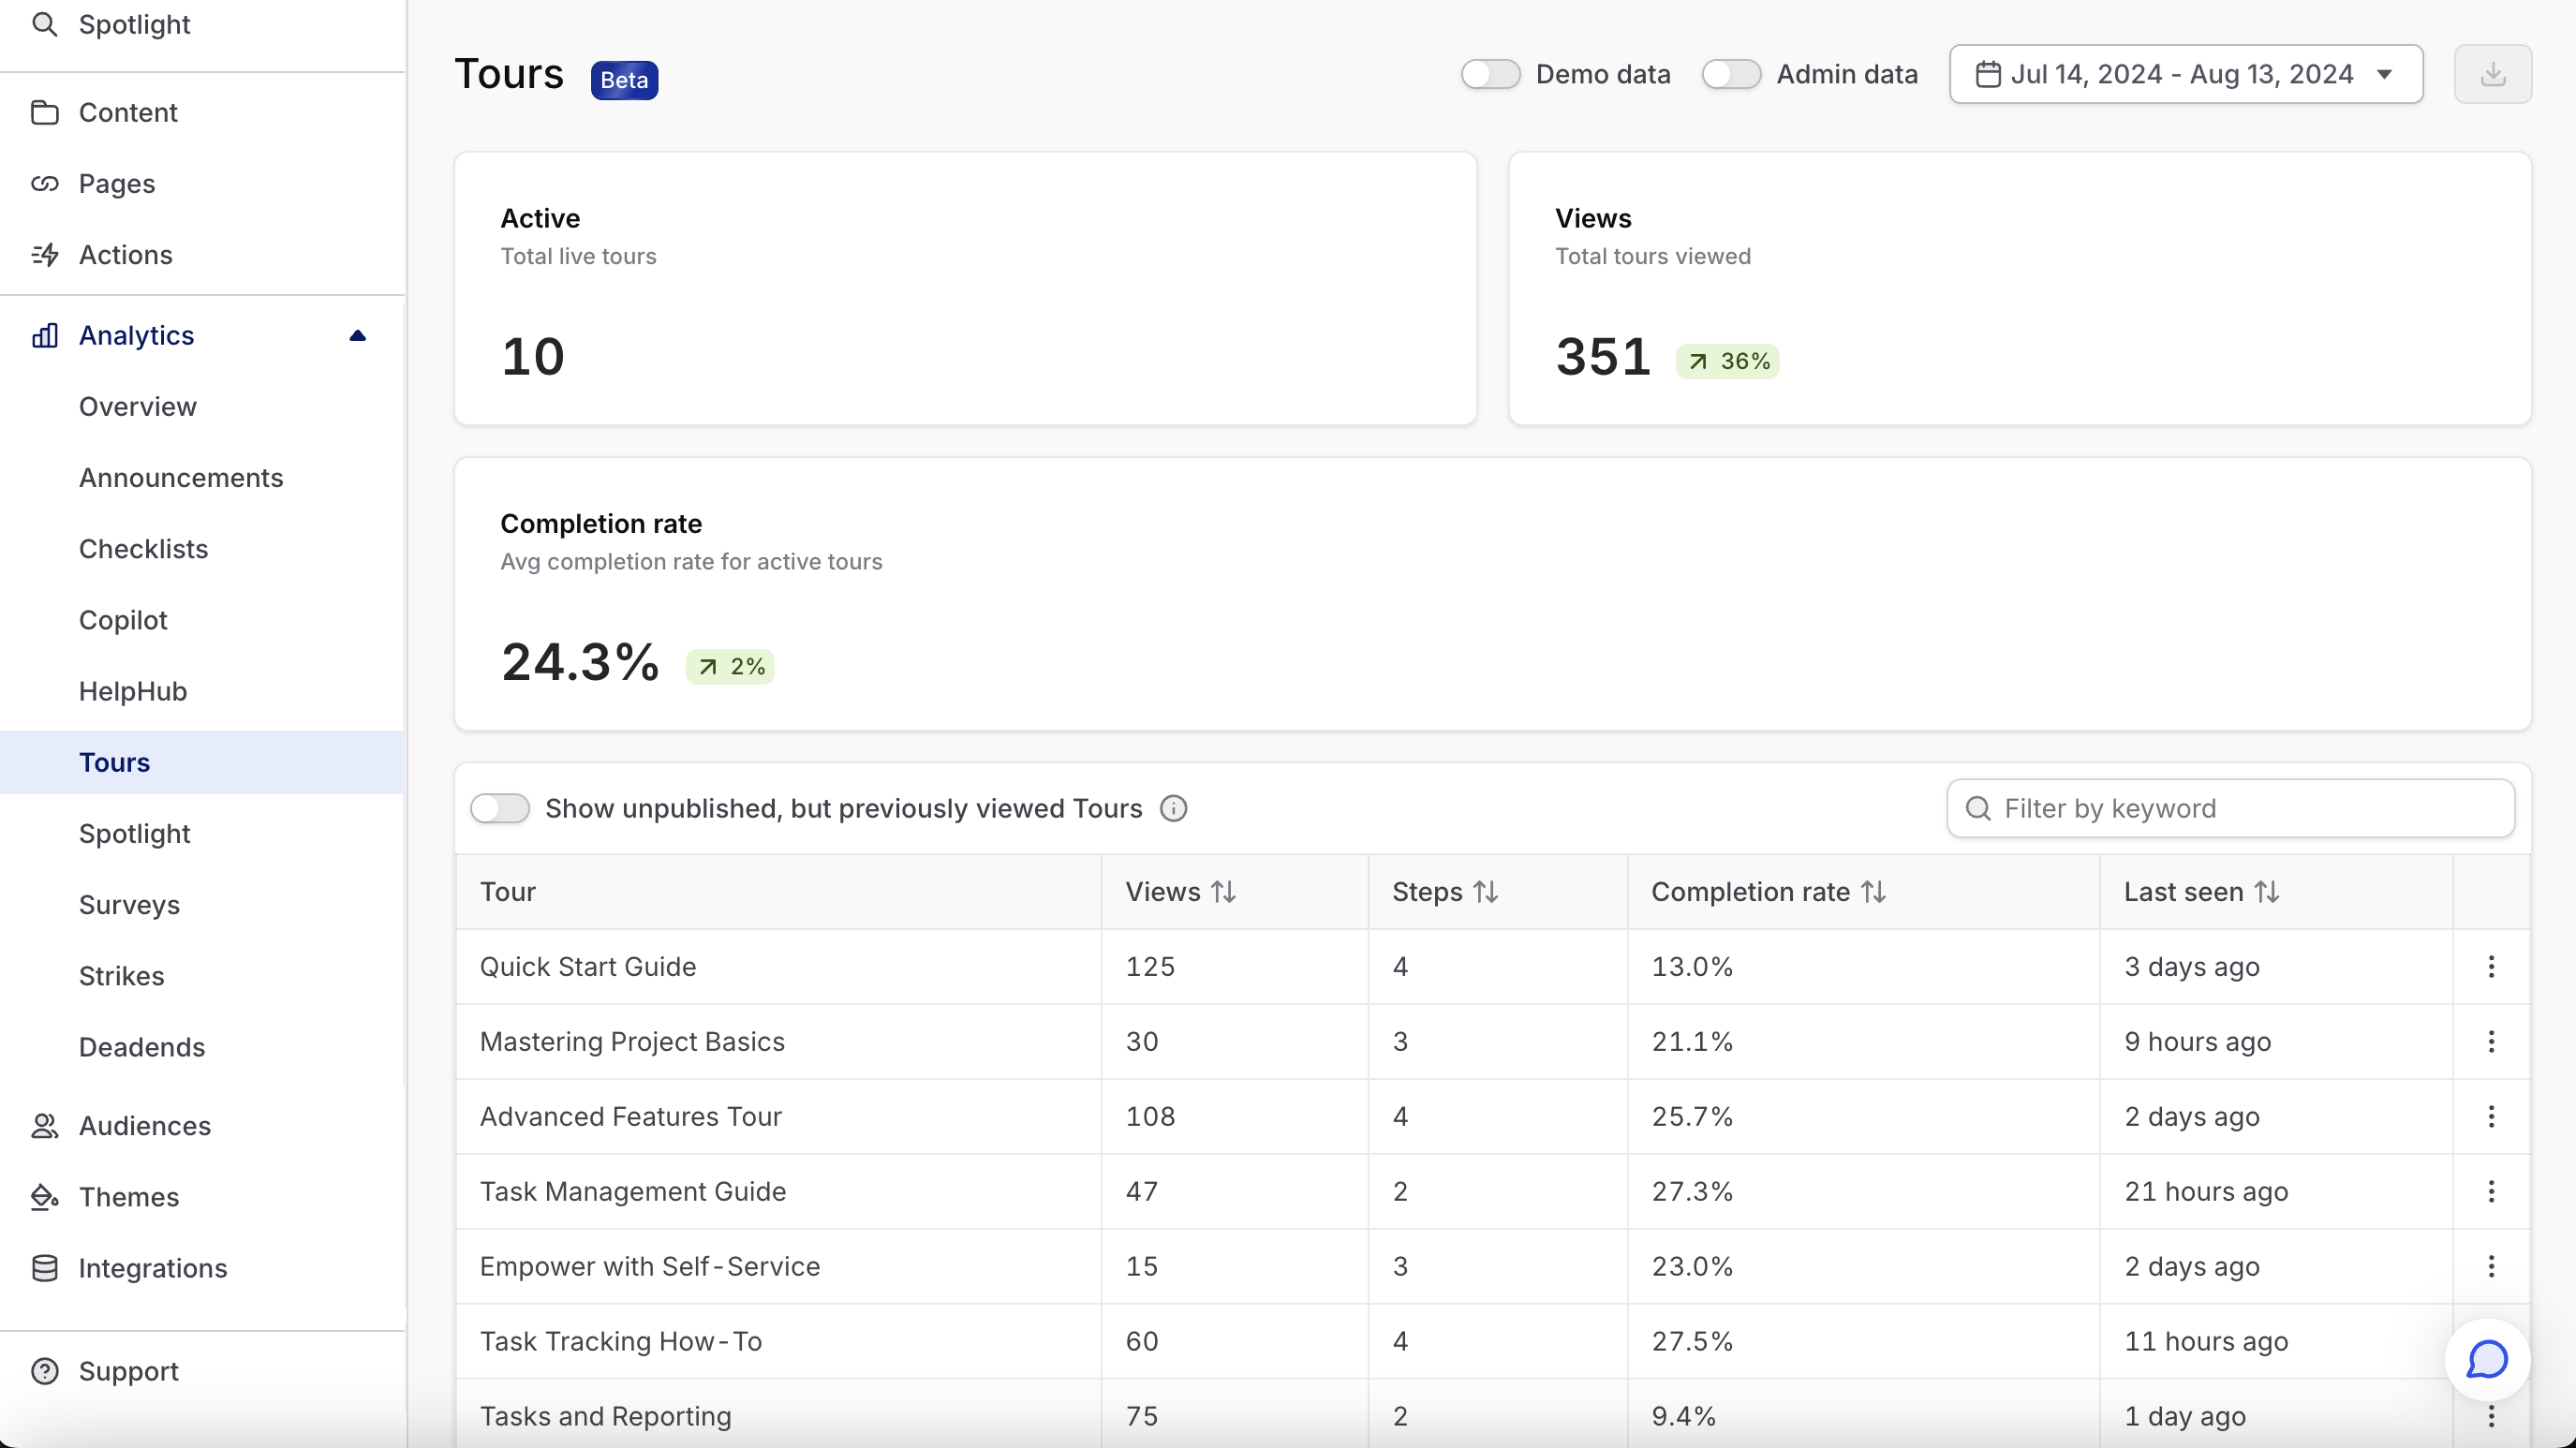
Overview page

Active tours
These are the number of product tour that are currently published to users. This represents the number of announcements that are capable of generating impressions. Note that this includes product tours that haven’t yet generated any user impressions (because no users have met the tour’s Who-Where-When conditions).
Views
This represents the total user views of product tours in the period you currently have selected (via the selector in the top right). Note that a view begins when a user sees the first step of a product tour. Viewing multiple steps counts as a single view.
Completion rate
Across all the views in your period, what percent ended with the user actually completing the tour. Completing means they reached the last step.
Tours table
For each tour in the table, you can view (a) the number of steps in that tour, (b) the completion rate of that tour, and (c) the last time the tour was seen.
You’ll generally notice a negative correlation between tour length and completion rate. The more you ask of a user, the less likely they are to follow through (unless your tour is finely targeted to only users who will be really interested, of course). A good practice for this table is to scan for low-completion-rate tours and note whether they correspond to your longer tours (more steps).
The last seen column is most useful for identifying tours whose targeting may need to be tweaked. If last seen hasn’t occurred for a while, then targeting might be too strict, or most eligible users might have already encountered it (making it a good candidate to unpublish, unless you expect more users to trigger its Who and When conditions in the future).
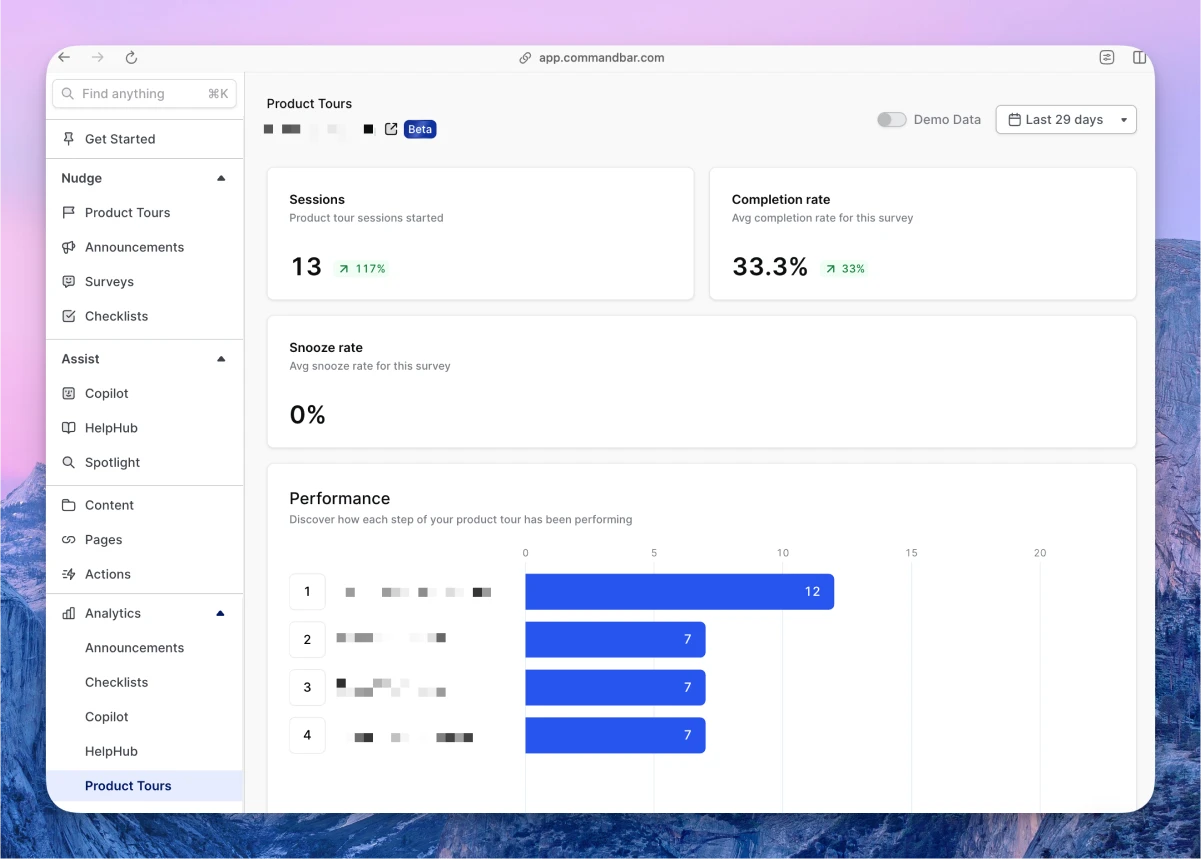
Tour drilldown
Clicking on any tour in the table at the bottom of the overview page will bring up a drilldown page. This page will show you metrics related to this specific tour.

Views
This represents the total user views of product tours in the period you currently have selected (via the selector in the top right) for this specific tour.
For tooltips, a View is counted when the tooltip icon is hovered/clicked and the tooltip message is displayed. We do not count a View when the tooltip element/symbol is on the page.
Completion
The completion rate of the tour for the specific period.
Snooze rate
The percentage of views that ended with the tour being snoozed.
Performance
This chart let’s you analyze each step of your tour for dropoff. Dropoff means the user quit the tour while on this step. This is usually a sign that the step isn’t effective, either because of its content (copy, media, etc), its targeting, or both.
The number next to the column to the right of the step shows the number of unique users have encountered of that step, which will be less than or equal to the number of tour views for that period.
Views
This shows every user who has had at least one impression of the tour, along with the outcome (whether they dismissed, generated a strike, completed, or abandoned mid-way).